

What is Tokenomics?

A few months ago, we analyzed Initial Coin Offering (ICO), a new way for companies to raise capital mainly in the technology sector which surged in 2013, and compared the new financial instrument with traditional financial instruments. In this article, we want to dig deeper into ICO and present a new scientific concept which derived from it: Tokenomics. The word “tokenomics” is a compound of the words “token” and “economics”. This term raised popularity in the middle of 2017 due to the high numbers of ICOs and different project models. Tokenomics contains all decisions around the implementation of a token within an ICO ecosystem. A token represents a digitally, cryptographically-secured unit of value which is created by distributed ledger technology such as blockchain. The token can be built on a new blockchain (native token) or on the top of another blockchain such as the ERC20 standard on the Ethereum platform. A token gives the owner a right which differs from one ICO project to another. You can have a right to Access a platform Purchase a product or service Vote Future profit-sharing Approval of changes in the code Example: Why are companies creating tokens? Imagine you found a hostel chain that should accept in future cryptocurrency as payment by the guests to avoid international banking fees as most of the guests come from abroad. As the founder doesn´t have any access to funds from friends & family, credit or venture capital, he decides to raise capital via an ICO to create its cryptocurrency and to finance its expansion and all related expenses (salary, advertising, rents, etc.) in the next five years. Hence the company offers a service which can be paid by a token. In practice, a project-specific token will be developed by programmers like for example the Primal Base Token, Ethereum or Filecoin which can be purchased via other cryptocurrencies or sometimes via fiat in an ICO. According to William Mougayar, author of the Business Blockchain (Wiley, 2016) a token in a business sense can be defined as: “A unit of value that an organization creates to self-govern its business model, and empower its users to interact with its products while facilitating the distribution and sharing of rewards and benefits to all of its stakeholders.” Apart from the technical design (smart contract, webwallet etc.), the hostel owner has to design a particular ecosystem in order to sell the token. This is called a token model which differ depending on the project from each other, but It includes the key following elements: Token Classification: Utility or Security A token is classified into different categories depending on functionality or legal requirements. The Swiss Financial Market Authority classifies tokens into payment tokens, utility tokens or asset tokens whereas the U.S. Security and Exchange Commission (SEC) published a guide in April 2019 which determines when a token fall under a security classification. A utility token is a digital asset that gives the owner the right to access a service or product of the platform. It is not an investment nor gives shares of the company. The price of the token can increase over time when the demand for the product or services is increasing. By contrast, the security token is an investment tool when it fulfills certain requirements which are tested by the Howey test. A token is a security token if it is a financial investment with an expectation of profit in a common enterprise and the profit is generated by a third party. If the token meets all the points, it must comply with the requirements of a traditional security (debt, equity, derivatives) by the SEC. Token Sales Model To mitigate risks and increase trust and transparency to future investors it is necessary to define a token sales structure. In this model, the details about the token, its economics, and the terms of the sale have to be clear. There are different token sales models and project owners constantly find new models to distribute the tokens. The most common ones are: – Uncapped token sale In the uncapped token model where an unknown number of tokens will be issued for a fixed rate. Early buyers can receive a promotion in the first weeks and the ICO has a specific distribution time. The most famous uncapped token sale was Ethereum in 2014 which ran for 42 days. The sale price started at 2000 Ethereum/Bitcoin in the first two weeks and increased after it linear to 1337 Ethereums/Bitcoin. There is a lot of critics regarding the uncapped token sale because of the high uncertainty of valuation and the fear of a dilution effect. – Capped token sale In a capped token sale, the token quantity is limited. In this model a soft cap, hard cap and hidden cap can be set. In a soft cap, after the cap is reached there is a certain time extension until the full closure whereas at a hard cap, the token sale stops once the cap is reached. In a hidden cap, the investors don´t know when the token distribution is finished. The capped token sales were more popular in the last years as it gives more transparency and trust to the investors regarding the valuation. In the first capped sales, the sale finished after a few hours and was accelerating with the time. For example, First Blood finished their 5.5 million USD sale in two minutes whereas BAT raised 35 million USD in 30 seconds. – Dutch auction The Dutch auction model is already known in Initial Public Offerings (IPO). The price is set after taking in all bids to determine the highest price at which the total offer can be sold. In July 2019, Alogrand raised more than 60 million USD in its Dutch auction mechanism. The 25 million tokens were sold at a price of 2.40 USD/Algo token. The foundation told that it will around 600 million Algos per year. – Reserve Dutch Auction In a reserve Dutch auction, the
Social intelligence in financial leadership (CFOs)

In 2008 Daniel Goleman and Richard Boyat, two renowned psychologists, published an article called “social intelligence and the biology of leadership” that completely changed my perspective of business, interaction among coworkers and leaders within organizations. Social intelligence is a field within neuroscience that studies how people connect to each other in order to achieve any goals and obtain high impact results. 1 Bosses who do not interact and do not connect with their people do not create synergies. What is interesting about this article is the argument that people within organizations interact as neurons in a neuron network. We are not separate individuals with separate heads, our minds connect like Wifi modems if we are able to feel empathy for others. In my experience as a consultant I see many departments within organizations that function as fiefs, people and bosses do not share information and do not interact with subordinates which creates a very hostile work environment. The lack of empathy permeates in all the organization which generates a very toxic environment that will impact directly in the organization performance. Regarding financial leadership, CFOs in many organizations, not only in Mexico but around the world are generally concerned about the aspirations and expectations for their CFO teams in helping to boost performance. Sometimes they forget about other areas or departments. The lack of transparency regarding information from bosses or leaders might lead to a disaster due to their incapacity to share and connect with other areas. Social intelligence is the ability to know oneself and to know others, in others words, to have self awareness and awareness for others. According to the Psychology Today publication, social intelligence develops from experience with people and learning from success and failures in social settings. 2 Besides social neuroscience studies the interaction among neurons and how social intelligence derives from this interactions; it studies what happens in the brain when people interact. Social intelligence is a concept based on the relations to assess leadership in organizations.It is a mix of soft skills builded over specific neural circuits and endocrine systems that inspire other to be more efficient. There are three kind of neurons that have a specific impact on social intelligence. First, there are mirror neurons which have an specific role in organizations because some followers reflect the same feelings and actions that the leaders try to encourage, this is a neuronal reflection. Related to this I would like to talk about laugh. Laughing reduces stress, thus leaders who encourage sense of humor within their teams are able to create more empathic, efficient and communicative environments. The second type of neurons are fusiform cells which are responsible for intuition in our brains. Some studies found that leadership is related to the capacity of pattern recognition and huge amount experience. Finally, the third type are the oscillating cells that coordinates people physically by regulating how and when bodies are supposed to move with other bodies. There is a lot of science behind this analysis and what is clear is that leadership and social intelligence are two important soft skills that decisions makers within organizations should have and encourage among their people in order to achieve goals and improve performance. For more interesting posts take a look at our media page and our social media. At Exitus Global we are always ready to help.
Análisis del Modelo de Negocios de las Plataformas de Streaming

En la actualidad, las plataformas de “streaming” forman parte importante de la vida de los consumidores, inclusive las grandes empresas están comenzando a explorar este mercado por ejemplo Apple o Disney. Por lo tanto, es importante analizar la viabilidad a largo plazo de esta línea de negocio y los problemas principales que afrontan las empresas competidoras. La empresa que popularizó este modelo innovador basado en suscripciones mensuales fue Netflix. Esta organización comenzó rentando películas en formato físico en 1997; sin embargo, en 2007 introdujo a sus consumidores la opción de reproducir contenido a través de internet. Este acontecimiento provocó que la empresa se expandiera a nivel internacional en 2010 y aumentará su número de suscriptores de 7.5 millones en 2007 a 158 millones en 2019. Netflix en 2017 logró igualar el número de suscriptores en su plataforma con el total de personas con televisión por cable en Estados Unidos. En un inicio Netflix creó un catálogo de contenido a partir de producciones de terceros, la empresa ofrecía un pago anual para contar con los derechos de éstas. Lo anterior, provoca que la empresa tenga que destinar anualmente cantidades importantes de efectivo para el pago de este concepto, además las creadoras de contenido pueden fijar las cuotas de manera arbitraria o decidir no renovar los contratos unilateralmente. Un ejemplo muy claro son los derechos por la serie Friends de WarnerMedia (empresa propiedad de AT&T), en 2019 Netflix pasó de pagar 30 millones de dólares a 100 millones de dólares anuales para conservar la serie en su catálogo. El principal factor que llevó a la empresa a pagar este monto fue el deseo de la WarnerMedia por crear su propia plataforma de contenido audiovisual. Netflix contempló esta situación desde 2013, cuando tomó la decisión de crear series y películas originales exclusivas para su plataforma. La primera serie original fue “House of Cards”, serie que llegó a costar más de 4.5 millones de dólares por episodio. La producción más costosa ha sido “The Crown”, por la cual invirtieron más de 140 millones de dólares por temporada. Netflix hasta 2018, ha invertido más de 12 mil millones de dólares para la creación de contenido exclusivo. Netflix para poder financiar esta estrategia de expansión agresiva, ha recurrido a la emisión de bonos en el mercado de deuda. Actualmente cuenta con una deuda a largo plazo por más de 12.4 mil millones de dólares. Esto puede ocasionar presión en el futuro, ya que la empresa ha tenido utilidad neta promedio por 519 millones de dólares de 2015 a 2018. Los intereses de la empresa han incrementado de 163 millones de dólares en 2015 a 378 millones en 2018. Por lo tanto, en el futuro el margen neto de la empresa podría verse afectado por el incremento de gastos financieros. A pesar de que la entidad parece tener mejores resultados basado en su margen neto (ha incrementado del 2% al 8% entre 2015 y 2018), si se analiza el flujo de efectivo, se obtienen resultados preocupantes: Como se puede observar en la tabla anterior, el flujo de caja generado por el negocio principal de la empresa (CF de operaciones) ha sido negativo desde 2015. Esto indica que la organización pierde dinero después de descontar todas las entradas y salidas de efectivo de la operación. Por lo tanto, la empresa ha tenido que buscar recursos externos para solventar la operación de la empresa (CF de Financiamiento). Netflix ha incrementado sus necesidades por financiamiento desde 2015 un 147%. Esto es preocupante, ya que la empresa debe subsistir gracias a sus operaciones; sin embargo, Netflix no ha logrado generar valor gracias al núcleo de su negocio. Este problema incrementará cuando la empresa tenga que amortizar el capital de su deuda financiera. Por lo tanto, debe pensar en la mejor manera de estructurar su calendario de pagos. Además, debe buscar optimizar procesos para conseguir que el flujo de operaciones de la empresa sea positivo. El inconveniente para Netflix es la nueva competencia que busca robarle participación de mercado: Apple y Disney. Estas dos empresas buscan arrebatarle mercado a la empresa pionera; sin embargo, ellos cuentas con recursos prácticamente ilimitados para financiar la creación de contenido a largo plazo, algo que Netflix no podrá lograr. Como se comentó en secciones anteriores, Netflix ha financiado mega producciones, pero no todas han generado interés a gran escala. Por ejemplo, la segunda serie más cara de su catálogo fue “The Get Down”, contenido que no fue renovado para una segunda temporada debido a los malos resultados obtenidos. Finalmente, la única manera en que Netflix, con su modelo de negocio actual, aumente los ingresos es a través de nuevos suscriptores; el problema es que en los últimos años ha disminuido su tasa de crecimiento en este concepto. Si la empresa no logra incrementar sus ingresos y optimizar sus costos en el corto plazo, no logrará solventar sus amortizaciones de capital de la deuda y será más complicado (e inclusive, más costoso) reestructurar estos vencimientos. Netflix ya logró revolucionar la industria del entretenimiento y necesita volverlo a intentar para sobrevivir a largo plazo. Elaborado por Javier Gómez Para más artículos como el anterior no dudes en revisar nuestra página de medios y nuestras redes sociales. En Exitus Global estamos para apoyarte.
Conoce el IMIET, el nuevo instrumento financiero

El levantamiento de capital en México usualmente lleva tiempo. De igual manera, hay múltiples regulaciones y detalles que complican o detienen el proceso. Desde la perspectiva de un emprendedor, tener una buena idea de negocio y contar con un buen equipo, pero no tener dinero para financiar dicho proyecto es algo sumamente frustrante. Esto ha detenido a muchas personas a lo largo del tiempo para llevar a cabo proyectos que probablemente hubieran sido plenamente exitosos. Es por eso que se deben conocer las fuentes de financiamiento que existen en México para poder desarrollar cualquier idea de negocio y así cumplir el sueño de aquel emprendedor. Otro obstáculo al cual se enfrentan ciertos emprendedores es el tener que dar participación de su negocio. Para esto, me gustaría compartir una frase que me parece muy interesante, “Para poder sumar hay que saber dividir”. Invertir en una simple idea de negocio conlleva un riesgo importante, por lo que hay que recompensar al inversionista por haber creído y permitido que dicha idea se desarrollara. Los fondos que invierten en etapas tempranas de un negocio son conocidos como Fondos de Capital de Riesgo (Venture Capitals). Estos fondos tienen cada uno sus propios lineamientos para invertir en diferentes negocios. En México, los instrumentos de inversión más comunes son los bonos convertibles, los cuales cobran interés y se pagan a vencimiento. En ocasiones se fija la participación a la que se convertirá desde un inicio. Estos procesos llevan bastante tiempo, suelen pasar 4-5 meses desde que se hace el pitch inicial hasta que la inversión culmina. Es por esto que MassChallenge, aceleradora de negocios, presentó un nuevo instrumento llamado el IMIET, creado con la finalidad de facilitar el proceso de inversión y así impulsar el emprendimiento en México. A diferencia de la mayoría de los instrumentos de inversión, el Instrumento Mexicano de Inversión en Etapas Tempranas (IMIET) considera las aportaciones de los inversionistas como capital y no como deuda. Esto quiere decir que, en primer lugar, no pagan intereses. Otra de las grandes ventajas que tiene este instrumento es la simplicidad del mismo. El proceso que este conlleva es amigable y el tiempo para cerrar un acuerdo puede disminuir de varios meses a 15 días, por ser un documento estandarizado. Dentro de los acuerdos que deben cerrarse previo a la inversión, los accionistas deben declarar que los fondos a invertir se destinarán a un futuro aumento de capital. De igual manera, se deben de definir el número de acciones que se emitirán en caso de que llegase a haber un evento de conversión. La idea de crear este instrumento por parte de MassChallenge se deriva de un instrumento muy similar en Estados Unidos llamado SAFE (Simple Agreement for Future Equity). Al igual que el IMIET, estos instrumentos son alternativas para los bonos convertibles comunes, los cuales pagan intereses y tiene otros ciertos requerimientos muy específicos. El IMIET tiene otras tantas ventajas, además de cumplir con la ley mexicana. Se espera que estas medidas se sigan tomando con la finalidad de impulsar el emprendimiento en nuestro país, al igual que el capital de riesgo. Referencias: Mass Challenge, Greenberg Traurig. (2019) Levantamiento de Capital, México. Angélica Pineda. (2018). MassChallenge simplifica el proceso para financiar startups. 2018, de Expansión Sitio web: https://expansion.mx/emprendedores/2018/09/27/masschallenge-simplifica-proceso-para-financiar-startups Para más artículos como el anterior no dudes en revisar nuestra página de medios y nuestras redes sociales. En Exitus Global estamos para apoyarte.
Patterns in Nature and Finance. The Fibonacci Sequence and the Golden Ratio.

As a management and finance consultant I’ve always been intrigued by patterns, not only in nature but also in some situations or circumstances that face many companies and startups. Patterns are everywhere and are defined by the Cambridge Dictionary as a particular way in which something is done, is organized, or happens. (1) Mankind has analyzed patterns in mother nature projecting them in art, biology, mathematics, music, history, architecture, finance and in many other fields. Such patterns have been applied in many works and are real examples of our reality we are experiencing in this universe. Here are some examples: One of the most famous pattern in nature is the golden ratio. To explain this pattern in a mathematical way we can say that two quantities are in golden ratio if their ratio is the same as the sum to the larger of the two quantities as it is shown in the following graph: The Greeks use the letters ϕ or φ to represent the golden ratio. It is calculated as follows: ϕ = (1 + ) / 2 = 1.6180339887 If we use this formula we can get the golden spirals or a Fibonacci spiral. Fibonacci (c. 1170- 1250) also known as Leonardo of Pisa or Leonardo the Traveller from Pisa popularized the Hindu-Arabic numeral system in the Western World. He used the golden ratio in related geometry problems, though never connected it to the series of numbers named after him. (2) The Fibonacci sequence is shown as follows: 1, 1, 2, 3, 5, 8, 13, 21, 34, 55, 89, 144, 233, 377, 610, 987, … By the way, Leonardo Da Vinci (1452 – 1519) who illustrated Luca Pacioli’s book, Divina proportione (1509), called the golden ratio as section aurea (golden section) and used this proportion or ratio in many of his paintings and works. The interesting thing here is that a German mathematician Simon Jacob was the one who noticed that consecutive Fibonacci numbers converge to the golden ratio. As you can notice, a given number equals the sum of the previous two consecutive numbers and therefore the golden ratio is the limit of the ratios of successive terms of the Fibonacci sequence (or any Fibonacci-like sequence), as it was discovered by Johannes Kepler (c. 1571-1630), another German mathematician. {\displaystyle \lim _{n\to \infty }{\frac {F_{n+1}}{F_{n}}}=\varphi .} Now let’s talk about the Fibonacci sequence in finance. A financial market analysis is based on data, graphs, price patterns and quotes. Fibonacci retracement is part of the technical analysis or more particularly a method to analyze and obtain support and resistance levels in prices. The name of this analysis comes after their use of the Fibonacci sequence. In other words, this financial analysis helps to verify correction price levels of a financial asset. These corrections help to identify support and resistance levels through retracements. (3) The most common and used Fibonacci cycles are 23.6%, 38.2% and 61.8% to identify retracements. This financial analysis is very well used by investor due to its simplicity and convenience. Here we can see a real example of the Fibonacci retracements in the financial markets. Finally, we can see that patterns, specifically the Fibonacci sequence, is used in many fields. In finance the Fibonacci retracement is used to identify support and resistance levels in prices or quotes of many financial assets. The beauty of patterns is at the eye of the viewer. Sources: (1) Definition of pattern. Cambridge Dictionary Online. URL: https://dictionary.cambridge.org/dictionary/english/pattern 2019 (2) Livio, Mario (2003) [2002]. The Golden Ratio: The Story of Phi, the World’s Most Astonishing Number (First trade paperback ed.). New York City: Broadway Books. ISBN 978-0-7679-0816-0. (3) Aspray, Tom (13 August 2011). “Fibonacci analysis – Master the basics”. Forbes. Retrieved 24 October 2016. Written by M.B.A. Francisco Montalvo. Para más artículos como el anterior no dudes en revisar nuestra página de medios y nuestras redes sociales. En Exitus Global estamos para apoyarte.
How did Thomas Cook pave the road to insolvency?
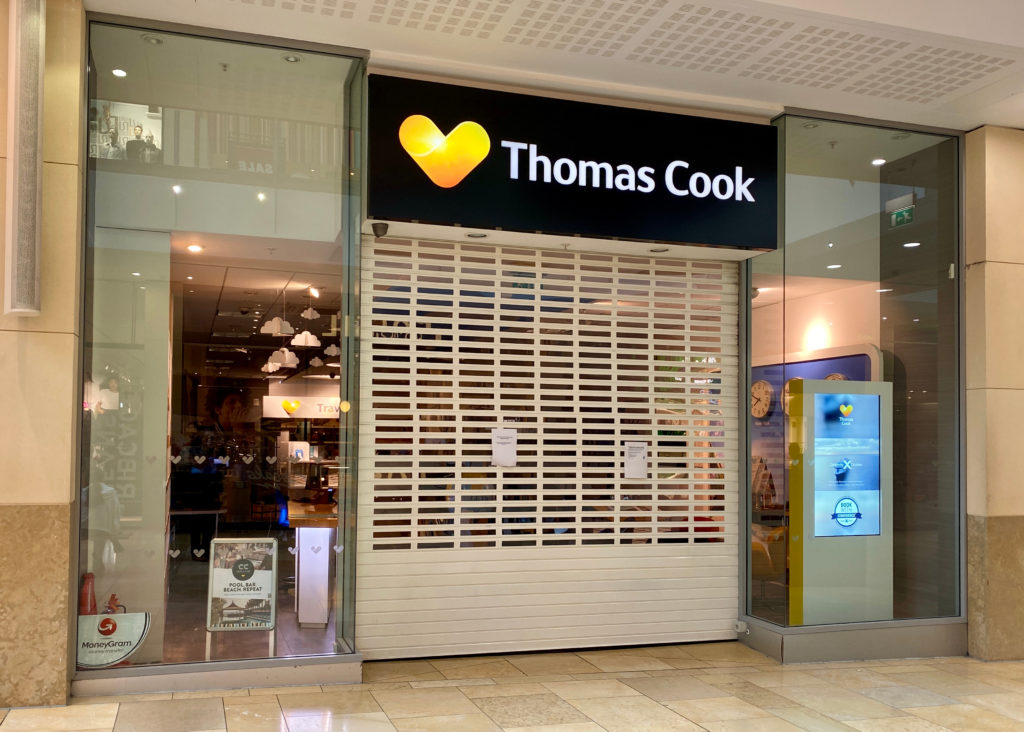
A lesson for entrepreneurs On September 23, 2019 Thomas Cook, one of the leading leisure-travel corporations filed for bankruptcy after a decade of financial trouble. The company was not able to secure a £200m lifeline. Thus, about 600,000 tourists were stranded around the world. It seems to be a trend, after Monarch Airlines, a British low-cost airline and tour operator, collapsed in 2017 and TUI shared a profit alert in March 2019. The industry The travel agency service industry is engaged in offering tour packages, providing online information, booking, reservation and payment services. The major market players are Expedia, TUI and Booking according to IBISWorld. However, the industry is highly fragmented as the four major market players have less than 25% of the market share. The industry reached an annualized revenue growth of 0.7% in the last five years and is expected to grow 2.7% only in 2019, resulting in a revenue of 307.2 billion USD. Until 2024, an annual growth rate of 3.6% is expected to reach a revenue of 366.4 billion USD. The revenue composition is as followed: Tours and vacation booking accounts for 45.4% in 2019 followed by cruise bookings with 22.3% and airline bookings with 14.2%. Accommodation commission accounts for almost 10 % of the revenue in 2019. The industry changed dramatically in the last years due to consumers using online channels. Hence, the market shares of online booking agencies increased strongly compared to traditional brick-and-mortar travel agencies. The global market of travel agencies consists of thousands of enterprises which are expected to drop at an annualized rate of 3.3% due to the pressure of the internet. The technology revolutionized the market providing better access to prices and travel destinations to the consumer and forced travel agents to become experts in certain types of travel and destinations. The key drivers of the market are the GDP of the BRIC nations as travel activities from those countries have risen very strong in the last years, tourist arrivals, internet usage, consumer sentiment index and income per capita. Emerging markets are coming up as South America, Asia and Eastern Europe are showing a substantial growth rate in tourism compared to western markets. The rise of Thomas Cook Thomas Cook was a leisure-tour-operator and distributor of travel package services, bundling flights, hotels, financial services like travel insurance and foreign exchange, local transfers, tours and even meals through operators via its own and third travel agency parties. Furthermore, the travel agency operated its airline (Thomas Cook Airline and Condor) and hotel chain (Casa Cook, Sentido and Sunprime Hotels). The British businessman Thomas Cook founded one of the oldest travel agencies in 1841 in Great Britain to offer a one-day rail excursion from Leicester to Loughborough. The company grew fast and after four years’ operations, he already offered his first international route from Leicester to Calais and expanded in the 1860s international with trips to Switzerland, Italy, Egypt and America. The company survived two world wars, being nationalized being part of the state-owned British Railways after the second world war and exceeded exceeding net profits of 1 million pounds the first time in 1965. It was privatized by a consortium of Midland Bank in the 1970s and sold in 1992 to a German Bank (Westdeutsche Landesbank) and LTU, a German charter airline. In 2007, Thomas Cook, as the second-largest European travel tour operator merged with its British competitor MyTravel Group plc to create a global powerhouse of tour operators. This deal resulted in Thomas Cook plc with revenues of more than 9 billion British pounds, operating in 21 countries and with more than 21 million customers worldwide. Thomas Cook´s key market is UK, Continental Europe and Northern Europe, with a strong focus on the UK and Germany where 49 % of the oversea holidaymaker booked a tour package. The revenue structure by business segment has been as followed: Between 2016 and 2018, Thomas Cook made on average 30 % of its revenue by airline and 70 % by its tour operator. In 2018, more than 50 % of the revenue came from Europe Continental followed by the UK and Northern Europe. It has to be considered that Thomas Cook adjusted its revenue to the underlying revenue which does not consider the internal revenue. Thus, official numbers may be different. The failure of Thomas Cook The business model worked for generations and the concept was considered as a quality brand with a solid reputation. The slogan: “Don´t just book it, Thomas Cook it” showed the all-inclusive aspect of the business model. The main question is: What happened to Thomas Cook, a 178-year-old established company? There are several reasons which led to the end of Thomas Cook. These are the main ones: Digitalization: Thomas Cook didn´t change its business models and slept over the digitalization. It announced its first alliance with Expedia in 2017 but was still heavily reliant on physical stores. The interest in package tours is declining as it is easier to organize your holidays on online platforms. Competition: Companies like Booking Holding and Expedia made it easier for customers to organize their holidays. Thus, the new generations didn´t contract a full holiday package. Airline operating costs: Thomas Cook entered into the airline business, acquiring the former Lufthansa subsidiary Condor, and opening its airline. Especially the airline business is quite expensive more price-competitive than the travel sector. Brexit: The never-ending Brexit process weighted heavily on the pound. Thus, many British people didn´t leave the country as it was too expensive. Furthermore, the uncertainty led to a lower demand. Weather conditions: The heatwave of the last summer led to a drop in the demand as many Europeans enjoyed their holidays at their sunny home. According to the German economic magazine Handelsblatt, the bankruptcy of the British travel agency Thomas Cook was only the iceberg of the package tours. Analyzing the past of the company, it showed that the reasons above mentioned are only a part of the failure. There is
Valuación de Unicornios: ¿Ilusión o Realidad?

En los últimos años el término “unicornio” en el mundo empresarial ha tomado gran importancia, especialmente en la industria tecnológica. El término fue acuñado por la inversionista en Venture Capital Aileen Lee durante el 2013 y hace referencia a las empresas de capital privado que tienen una valuación superior a mil millones de dólares. La plataforma CB Insights cuenta con una base de datos con los “unicornios” a octubre de 2019. De acuerdo a esta lista, actualmente existen 409 empresas con estas características a nivel global (sólo en 2019 han ingresado 100 nuevas organizaciones al listado), un número superior a las 39 que existían en 2013 cuando el término fue creado. Este crecimiento hace cuestionar la viabilidad a largo plazo de las criaturas mitológicas y las valuaciones utilizadas por los fondos de inversión para asignar estos valores. Por lo tanto, en el siguiente artículo se presenta un análisis a detalle de esta lista y las problemáticas estructurales en el modelo de negocio actual de estas entidades. La mayor concentración de “unicornios” se encuentra en los Estados Unidos con el 47.3% del total, mientras que Asia es el continente con mayor cantidad de países en la lista con 10, estos acumulan el 38% de las startups con dichas características a nivel global. Los siete países con más entidades son: Estados Unidos, China, Reino Unido, India, Indonesia, Alemania y Corea del Sur. Al analizar los diez “unicornios” con mayor valuación, seis fueron constituidos en los Estados Unidos, tres en China y uno en Singapur. Las industrias que presentan un mayor número de “unicornios” son las relacionadas con la tecnología, ya que el desarrollo de hardware y software (16%), fintech (12%) y e-commerce (12%) son las ramas que presentan una mayor concentración. Otra categoría que ha tomado relevancia en los últimos años es la inteligencia artificial. Ilustración 1.- Distribución “Unicornios” por País e Industria. Elaboración Expansion con datos de CB insight. La gran mayoría de los fondos de inversión invierten en estas empresas esperando obtener un beneficio a mediano plazo mediante un IPO (Oferta Pública Inicial) o una transacción de M&A (fusiones y adquisiciones). De acuerdo al reporte Money Tree del Tercer Trimestre de 2019 redactado por CB Insights y PwC, las salidas a partir de IPO’s han disminuido a comparación de las salidas por M&A. En el tercer trimestre de 2017, las salidas por IPO’s representan el 13.5% del total, mientras que en el tercer trimestre de 2019 esta proporción disminuyó a 11.8%. En el momento en que una empresa decide cotizar en la bolsa deja que el público inversionista cuestiona su modelo de negocios y éste genera una nueva valuación más estricta a partir de la información reportada. Esto explica porque en los últimos años la mayoría de los “unicornios” que realizaron su IPO están cotizando a un precio inferior al inicio, ya que el mercado percibe que su modelo de negocios parece no ser sostenible a largo plazo. Empresas como Uber o Snapchat que en sus reportes financieros presentan problemáticas similares como: pérdidas multimillonarias, flujos de efectivo negativos y que no plantean lograr rentabilidad a mediano plazo. Al combinar estos tres elementos generan desconfianza en los inversionistas y repercute de manera negativa en la valuación previa al IPO, lo que equivale a pérdidas para los fondos de inversión que invirtieron a un precio por acción superior en las rondas de financiamiento previas. Otro motivo por el que los inversionistas prefieren salir mediante transacciones de M&A son los problemas de liquidez. Los modelos de negocios innovadores se caracterizan por una alta necesidad de efectivo, en consecuencia, para evitar que la compañía se quede sin recursos para poder operar, prefieren venderla a otra empresa más grande. En la siguiente ilustración se presentan los “unicornios” con mayor valuación en la actualidad, es interesante analizar el presente de estas empresas ya que de los cinco principales, cuatro están rodeados por problemas financieros y administrativos. Ilustración 3.- Valuación de “Unicornios” más Valiosos a Nivel Mundial 2020. Elaboración Statista. Toutiao (Bytedance) es una empresa creada en China dedicada al desarrollo de plataformas digitales (redes sociales) con sofisticados sistemas de inteligencia artificial. La empresa logró una valuación de 75 mil millones de dólares a finales de 2018, cuando obtuvo recursos por 3 mil millones de dólares en una ronda de inversión liderada por SoftBank. Según personas cercanas a Bytedance, el año pasado reportó ingresos entre 3 y 5 mil millones de dólares, sin embargo no ha logrado generar utilidad neta en los últimos años. Además, la mayoría de su ingreso proviene de publicidad, por lo tanto los inversionistas se cuestionan la capacidad de la empresa para mantener ingresos estables a largo plazo (problema similar sufrió Facebook durante sus primeros años). Otra cuestión importante es la desaceleración económica que sufre China, lo que afectaría de manera directa los ingresos de la empresa. Por último, la entidad cuenta con poca participación internacional, por este motivo ha invertido una gran cantidad de recursos en la expansión de plataformas como TikTok (red social enfocada en videos de corta duración), aunque dichas plataformas aún no logran generar ingresos debido a que se encuentra en su fase inicial de operación. La segunda startup más valiosa es Didi Chuxing, empresa dedicada a la movilidad y principal competidor de Uber a nivel mundial. Uber realizó su IPO durante la primera mitad de 2019, obteniendo resultados adversos y reduciendo la valuación alcanzada en su última ronda de inversión previa al IPO. Este antecedente afecta directamente a Didi, ya que sufre las mismas problemáticas estructurales que su principal competidor. Personas cercanas a Didi reportan que durante 2018 sufrió pérdidas por 1.8 mil millones de dólares, superiores a las reportadas por Uber en el mismo periodo (aproximadamente mil millones de dólares). El problema principal es que la empresa busca una estrategia de expansión agresiva en mercados emergentes, donde Uber es líder, por lo que competirá mediante precio, de manera que reducirá aún más los márgenes de ganancia de la empresa. Al
The restaurant chain in crisis: Turmoil at Vapiano

The business model of the Italian lifestyle brand Vapiano is simple: Innovative “Fresh Casual Dining” (FCD) located between a quick-service-restaurant like McDonalds and classical seated dining restaurants. Once the guest enters the restaurant, he receives a card that he shows when he is ordering pizza, pasta, or salads on the counter. The food is made from scratch daily with fresh ingredients and cooked in a few minutes in front of the guest. The payment is done by leaving the restaurant with the amount on the card. The price is also reasonable between 8 and 15 euros. The German restaurant chain founded in 2002 in Hamburg with headquarters in Colonia was a success story in the last 10 years: Restaurant base increased thirteenfold between 2006 and 2019, from 17 to 235 restaurants in thirty-three countries. Over 30% of the restaurants are based in Germany, followed by around 25% in the rest of Europe and around 45% inthe rest of the world. The restaurants are opened as corporate/joint ventures or franchises By 2020, the company aims to have 330 restaurants worldwide carrying their logo In 2017, the restaurant was voted as the favorite restaurant for vegetarians and vegans by a German NGO, representing their interest 66% brand awareness in Germany 92% of the guests in Germany and Austria would recommend Vapiano In the top three of FCD market share in Western European countries like Sweden (~13%), Germany and Austria (~13%), France (~6%), England and Netherlands (~1%) Constant growth in net sales (CAGR: 28%) between 2014 and 2017, increasing from 152 million to 249 million Euros adjusted for acquisitions which included only corporate and joint venture restaurants and almost 500 million in 2017 with franchise included Successful IPO at the Frankfurt Stock Exchange in 2017, raising about 184 million euros resulting in a valuation of about 553 million euros The restaurant chain had a lot of success until 2015, but later on, wrong decisions and bad luck turned the game. There has been news about hygiene deficiencies in individual restaurants and a low work performance of employees, which are a disaster of a restaurant chain like Vapiano. The new CEO Jochen Halfmann with a jewelry and perfumery industry background, tackled these issues, but they had made other strategic mistakes like too long preparation time of new dishes. Fast preparation time is a promise of Vapiano which couldn’t keep. After the successful IPO in 2017, Vapiano realized an aggressive expansion by opening new restaurants at a fast rate (including Mexico, Brazil, Saudi Arabia, Egypt, and China) to reach 330 locations by 2020. This aggressive strategy led to mistakes like location selection and a lot of locations made a lower revenue than internally expected. The CEO Jochen Halfmann resigned on November 30, 2018, and Cornelius Everke (former Starbucks CEO) took over. As a consequence of the strategic decisions made in 2018 sales increased because of new openings which also provoked a loss of 101 million euros in the fiscal year. (after losses of 31 million euros in 2017). It has reduced the equity from 131 million at the beginning of 2018 to 46 million euros even considering a capital increase of 20 million euros at the end of the year. The equity ratio fell to 13.3% compared to 2017, with 37.4%. The liabilities increased very strong because of non-compliance with financial covenants. Thus, a revolving credit facility had to be reclassified. The events of 2018 also impacted the cash flow of operating activities which was -915.000 euros in comparison with 11 million euros in the previous year. This is mainly because of negative business development and newly opened restaurants. Normally public companies have 3 months to publish their financial statements and it is not unusual that companies take more time, but Vapiano lasted a lot of time to present the results of the first six months in 2019. It is not new that the company is in a crisis due to the expansion strategy and decreasing guest loyalty. In 2018, the publication of the financial statements was postponed three times as a loan of 30 million euros was needed. The negative trend of 2017 and 2018 keeps up in 2019 as the financial results of the first six months show. The consolidated revenue increased to 196.6 million euros, mainly due to new openings and acquisitions. Considering the same restaurants (like-for-like sales) of 2018, the revenue decreased by 3.2%. Because of the amendment of IFRS 16 leases, the liabilities of Vapiano increased sharply as they don’t own any restaurant. The liabilities increased to 470 million euros (199 million euros without IFRS 16) which is higher than the yearly consolidated revenue. The equity ratio decreased to 2% (5% without IFRS 16) including the effects of IFRS 16 due to the negative results (-34 million euros). Even by not considering the impact of the IFRS 16 on the financial position, the future looks still gloomy. The leverage (Net debt/EBITDA) is going to be between 8 and 10 times which is quite high for a company and not acceptable by financial institutions. This ratio should be below 3.5 times as it was at the end of 2017 (3.05x). The new CEO Cornelius Everke resigned surprisingly on August 30th, 2019, 9 months after taking over and deepening the crisis in the restaurant chain. After him CEO Vanessa Hall wants to increase guest loyalty and lead the restaurant to a positive free cash flow in 2020 and break-even by 2021. The case study of Vapiano shows the consequences of an aggressive expansion strategy of a young company. The learnings are that it is not possible to have both a fast expansion and a good service quality. Once there are strategic mistakes, the financial consequences will be big. A fast expansion strategy leads to mistakes in planning, such as location selection and contracting qualified employees. My recommendations for Vapiano and any company with a fast growth rate are: Reducing growth rate to complete any analysis without mistakes Consider any factor in the expansion strategy plan such as employees, complexity of the product, new
Value Creation and ROIC (Return on Invested Capital)

Companies create value when they perform actions that increase the worth of goods and services. There are two ways to measure value creation; the first one is growth and the second one is through ROIC (return on invested capital). Growth is easy to explain and easy to see inside the companies. When there is more demand for products and services therefore production increases, employers hire more people and more CAPEX (investment in equipment, machinery and working capital) is needed . Then return on invested capital (ROIC) another measure for value creation, represents what will be the yield that a company obtains after investing in capital. This can be obtained with the following formula: Net Operating Profit After Taxes (NOPAT) / Total Invested Capital So at the end, this ratio shows a yield or return that a company gets after investing money in equipment, machinery and or working capital. Also, another way to understand growth is by multiplying ROIC times investment rate. Growth = ROIC * Investment rate According to some ex-McKinseys consultants, the more growth and capital deployment at attractive rates of return, the more value they create. The combination of growth and return on invested capital (ROIC), at higher rates compared to its cost of capital (WACC), is what drives and creates real value for a company. Besides some studies made by a prestigious consulting firm demonstrate that investments in research and development (R&D) correlate with positive long-term returns to shareholders and therefore creating value to the company. Another concept to be addressed is cost of capital. In this section we will not explain WACC or cost of capital in more detail but it is important to consider it in order to determine the value of a company: Value = Free Cash Flow year 1 / (WACC or cost of capital – growth rate) Free cash flow is the cash flow generated by the business, or “money left in the pocket”. In the other hand, growth rate is the rate at which the company’s NOPAT, Net Income and cash flow grow each year. Another pattern is that many companies, especially in Mexico, only focus on the short-term. Decision makers should make decisions for the long-term, even if that means making some sacrifices. When businesses only focus in the short term that is a formula for disaster. The result throughout history is a financial crisis. Annualized TRS. 1996-2005. % Growth Change in ROIC Below Average Decreased Below Average Increased Above Average Decreased Above Average Increased Source: Bin Jiang and Tim Koller, “How to Choose between Growth and ROIC”. McKinsey on Finance, no. 25 (Autumn 2007) 19-22. Para más artículos como el anterior no dudes en revisar nuestra página de medios y nuestras redes sociales. En Exitus Global estamos para apoyarte.
La Industria de Fabricación de Productos de Azúcar y Confitería en México

La industria manufacturera de productos de azúcar y confitería en México comprende la producción de azúcares, chocolates, dulces, chicles y otros productos de confitería. El 40% de los ingresos para esta industria son generados por el chocolate y los dulces. Este sector aporta a industrias como la panadería, producción de galletas, manufactura de tortillas y harinas premezcladas; y la manufactura de comida en general. Una determinante crucial para el desempeño de esta industria es el comercio, cada año las exportaciones tan solo a Estados unidos representan aproximadamente un 25% de los ingresos; tan solo en 2019 esta cifra representó el 26.9% de los ingresos para la industria. A nivel global las exportaciones representan aproximadamente un 32.1%, mientras que las importaciones solo generan un 12% de los ingresos. Debido a la accesibilidad de las exportaciones en el extranjero su valor total ha aumentado un 2.1% anualizado llegando a los $ 41.6 mil millones de MXN durante el período de 2014 a 2019; esto demuestra la viabilidad de crecimiento que presenta la industria. Se espera que el comercio permanezca como una determinante clave de los ingresos de la industria en los próximos cinco años, representando hasta un 35.2% de los ingresos totales de la industria para 2024. Se pronostica que los ingresos de la industria presenten un crecimiento a una tasa anualizada de 0.9% a MXN $ 135.9 mil millones durante los cinco años para 2024. Factores que impactan la industria: Consumo de Bebidas Azucaradas Precio del Azúcar Gasto de los Consumidores Población Mundial Segmentación de los productos de la industria Dentro de la categoría de dulces se encuentran caramelos, chicles y gomas de dulce; por otro lado, en la categoría de azucares se encuentran productos como caña de azúcar. Los competidores más grandes de México para la industria son Beta San Miguel SA de CV, Zucarmex SA de CV, Grupo Bimbo SAB de CV y Mondelez International Inc.; dichos competidores no representan más del 35% de la industria por los que las barreras de entrada y la competencia aún no se encuentran centralizadas haciendo accesible la entrada de nuevos competidores al mercado. Elaborado por Karen Milla Fuentes: IBISWorld. (2019). IBISWorld Industry Report 3113MX Sugar & Confectionery Product Manufacturing in Mexico. Colombia University: IBISWorld Inc. Para más artículos como el anterior no dudes en revisar nuestra página de medios y nuestras redes sociales. En Exitus Global estamos para apoyarte.
